Reproducible Reporting
with Quarto
![]()
Acknowledgements

![]()
R/Medicine Data Cleaning 2023 Workshop taught by Crystal Lewis, Shannon Pileggi, and Peter Higgins
ASA Traveling Courses on Quarto taught by Mine Çetinkaya-Rundel and Andrew Bray
Jadey Ryan
Data scientist at WA Dept of Agriculture
The Coding Cats: cat & code themed merch

R Markdown is an authoring framework supported by many R packages
Figure from “Hello, Quarto” keynote by Julia Lowndes and Mine Çetinkaya-Rundel, presented at RStudio::Conf(2022).
Quarto is a publishing system that supports many multiple & outputs
R Markdown vs Quarto

R Markdown
Vast R Markdown ecosystem
Dependent on R

Quarto
Command line interface (CLI)
Expands R Markdown ecosystem
“Batteries included”
Multi-language and multi-engine
If you’re happy with R Markdown and it’s not broken, no need to switch!
R Markdown will still be maintained but likely no new features (Xie 2022).
How I use Quarto

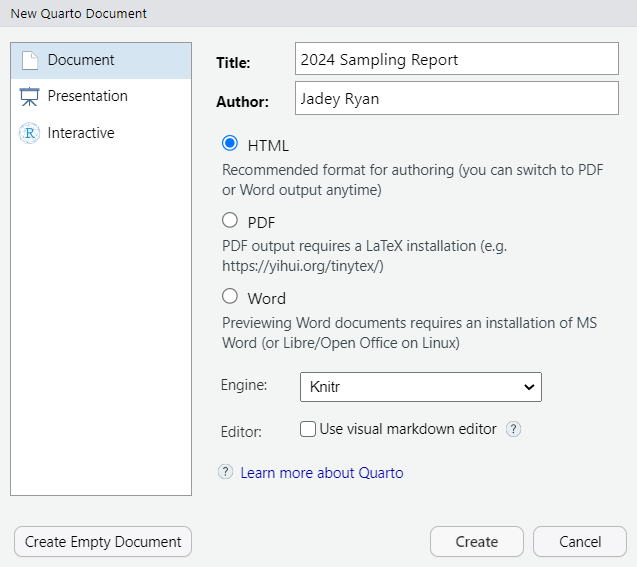
Create a single Quarto document
One .qmd file for a report, presentation, or dashboard
File > New File > Quarto Document…
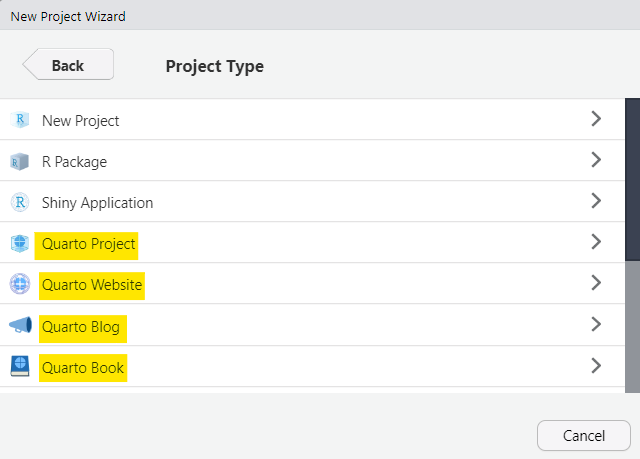
Create a Quarto project
Multiple .qmd files for a website, blog, or book
File > New Project > New Directory > Quarto Project/Website/Blog/Book
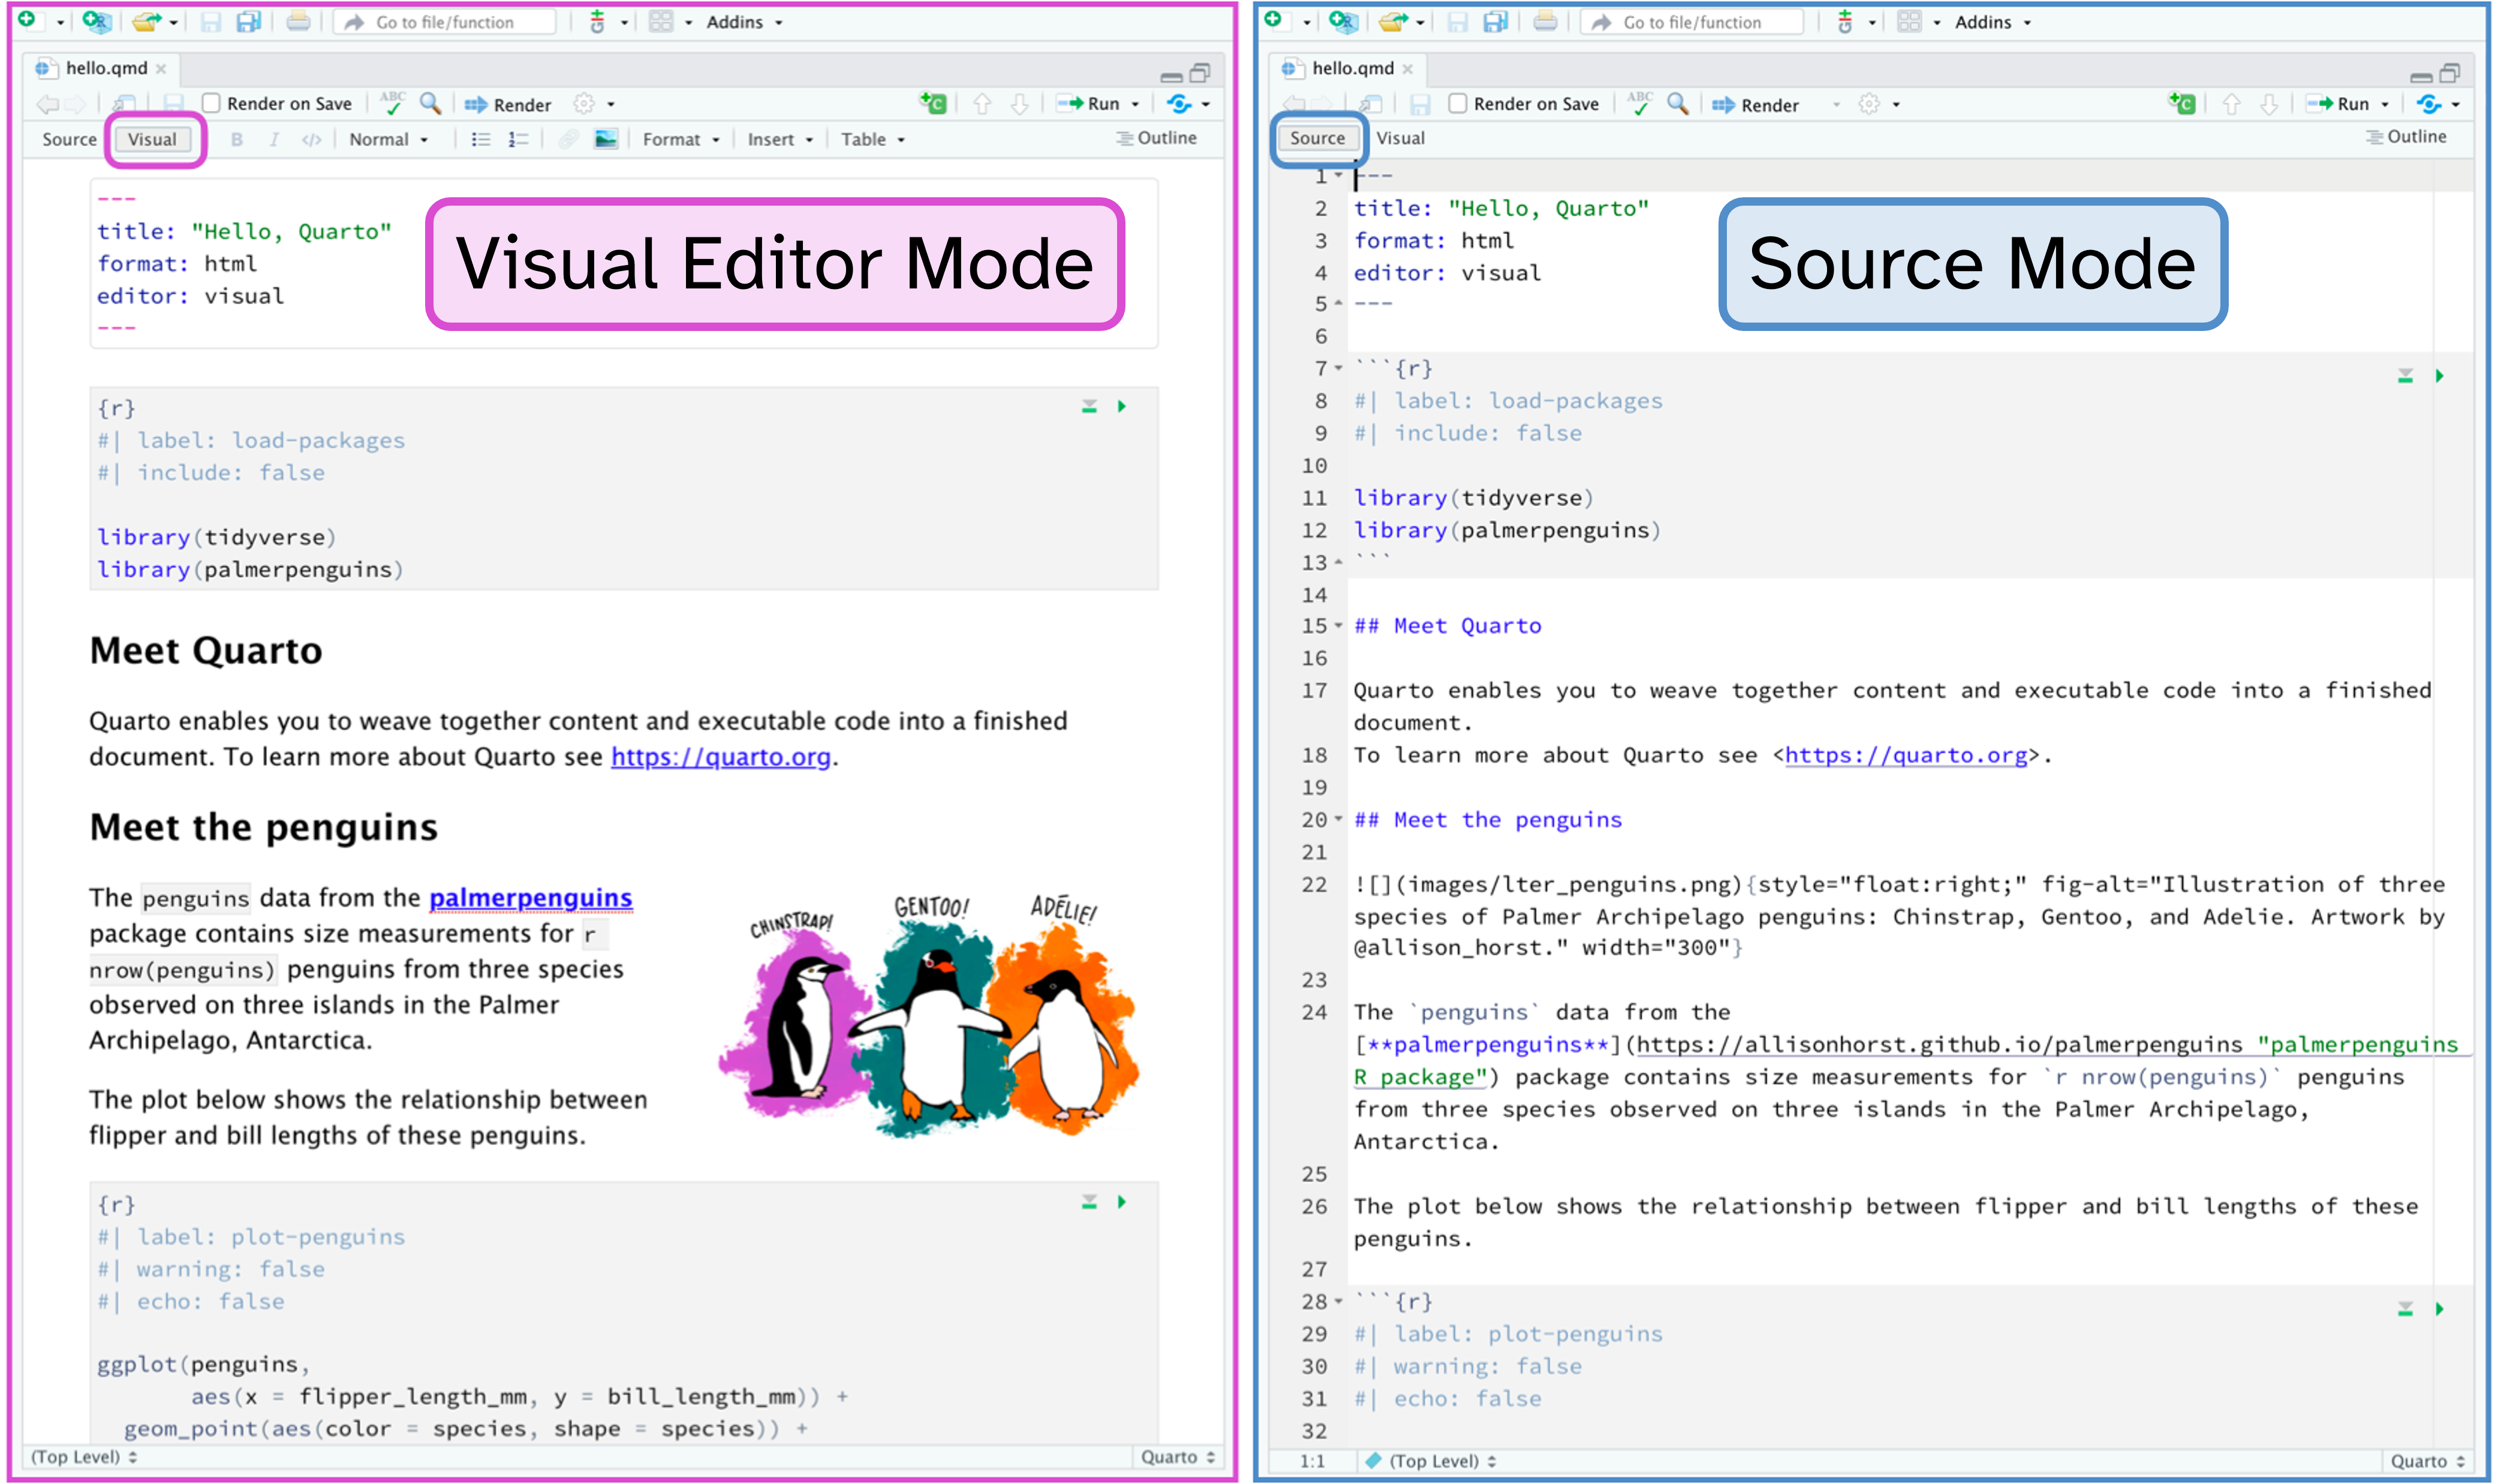
Authoring
Toggle between Visual and Source modes with Cmd/Ctrl + Shift+ F4.
Three ways to render
- Use the RStudio/Quarto integration
![]() Render button to render the file and preview the output.
Render button to render the file and preview the output.
Keyboard shortcut: Cmd/Ctrl + Shift + K
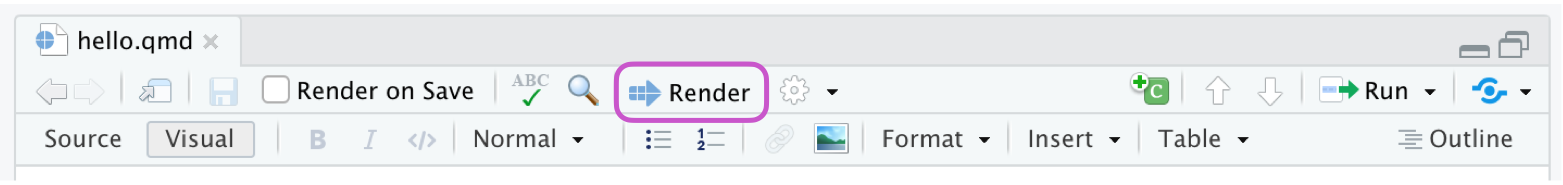
Check the Render on Save option to automatically render and update the preview after saving.
💪🏼 Exercise 1-2
Render the document using the
![Quarto render button in RStudio]() Render button.
Render button.Modify the text and code, render using the
quartopackage, and review the output.Check the Render on Save option, make more changes, save, and watch the preview update.
03:00
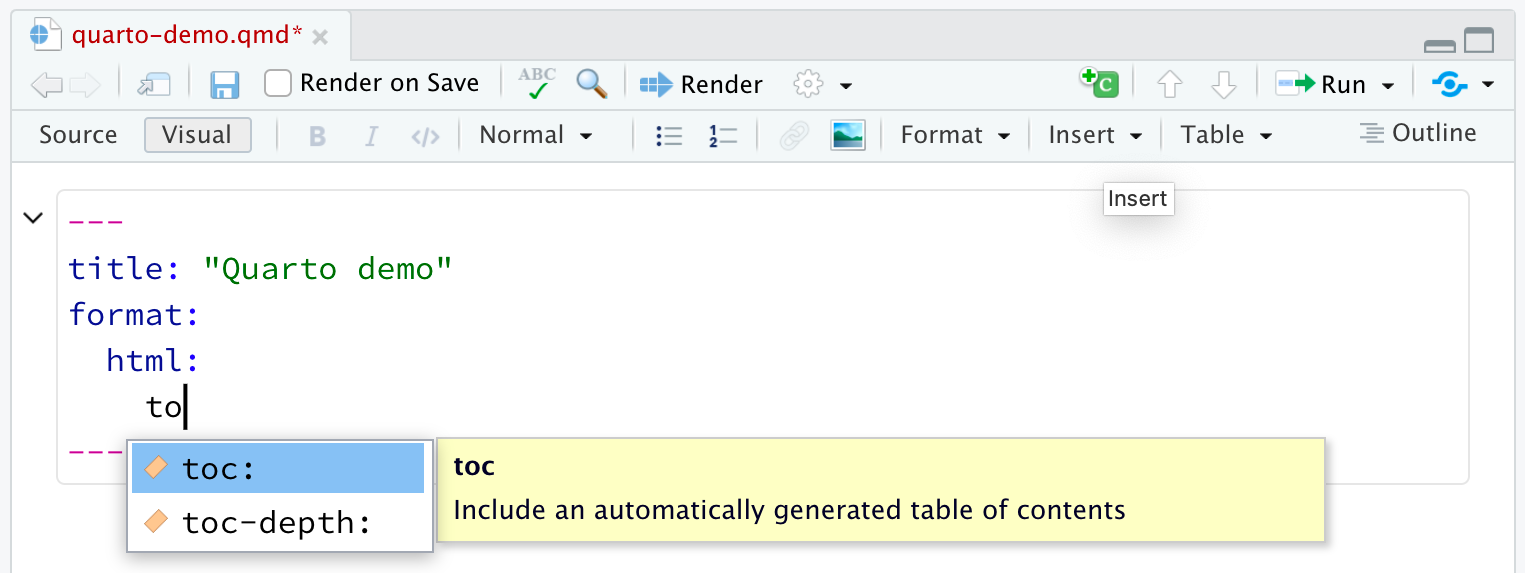
YAML intelligence: tab-completion
Start a word and then Tab to complete.
Cmd/Ctrl+Spaceto see all available options.
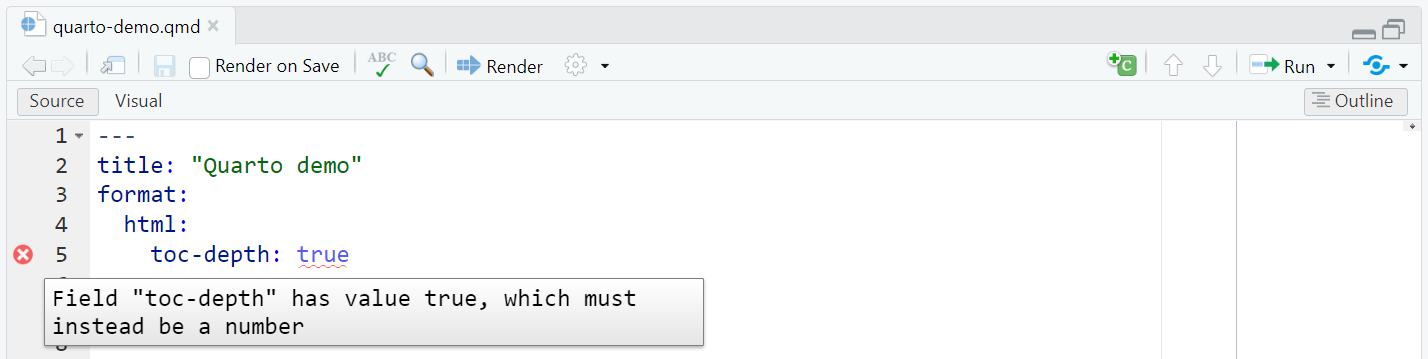
YAML intelligence: diagnostics
Incorrect YAML is highlighted when documents are saved:
3. Code chunks (or cells or blocks)
Three ways to insert code chunks:
Keyboard shortcut
Cmd/Ctrl+Option/Alt+I.![Insert Chunk button in RStudio]() Insert Chunk button in the editor toolbar.
Insert Chunk button in the editor toolbar.Manually type the chunk delimiters
```{r}and```.
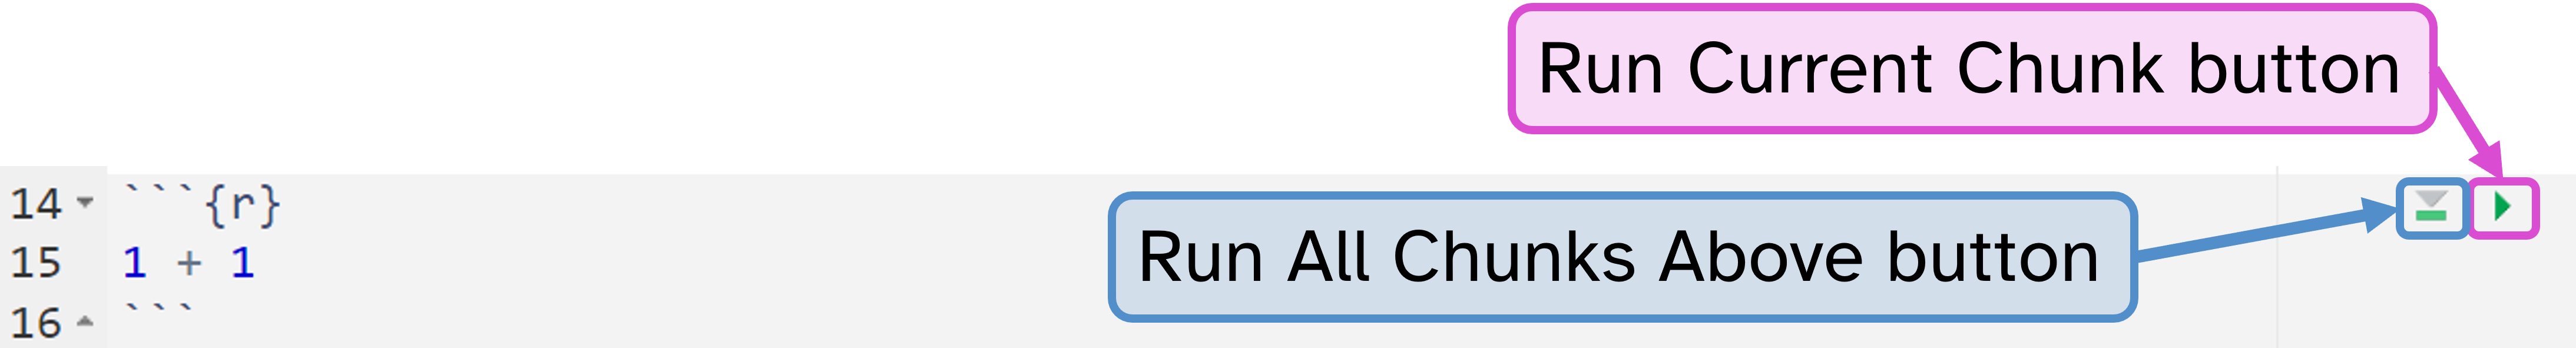
Two ways to run code chunks:
Use the Run Current Chunk or Run All Chunks Above buttons.
![Code chunk in RStudio with the Run All Chunks Above and Run Current Chunk buttons highlighted and labelled.]()
Run the current code chunk with
Cmd/Ctrl+Shift+Enter.
Optional code chunk labels
Use a hashpipe (#|) to specify labels.
Improve documentation and navigation.
Many use cases

Different audiences, different reports
Show code for technical staff and hide code for everyone else (StackOverflow example).
Like a custom function
💪🏼 Exercise 2
Explore a report without parameters and see where we could add them.
Open
2-swiss-cats.qmd.Click the
![Quarto render button in RStudio]() Render button.
Render button.Look at the source markdown & code and the rendered report.
💬 Discuss: What variables could we set as parameters?
💡 Hint: run the
setupchunk and look at thepetsdataframe to see what variables it has.
05:00
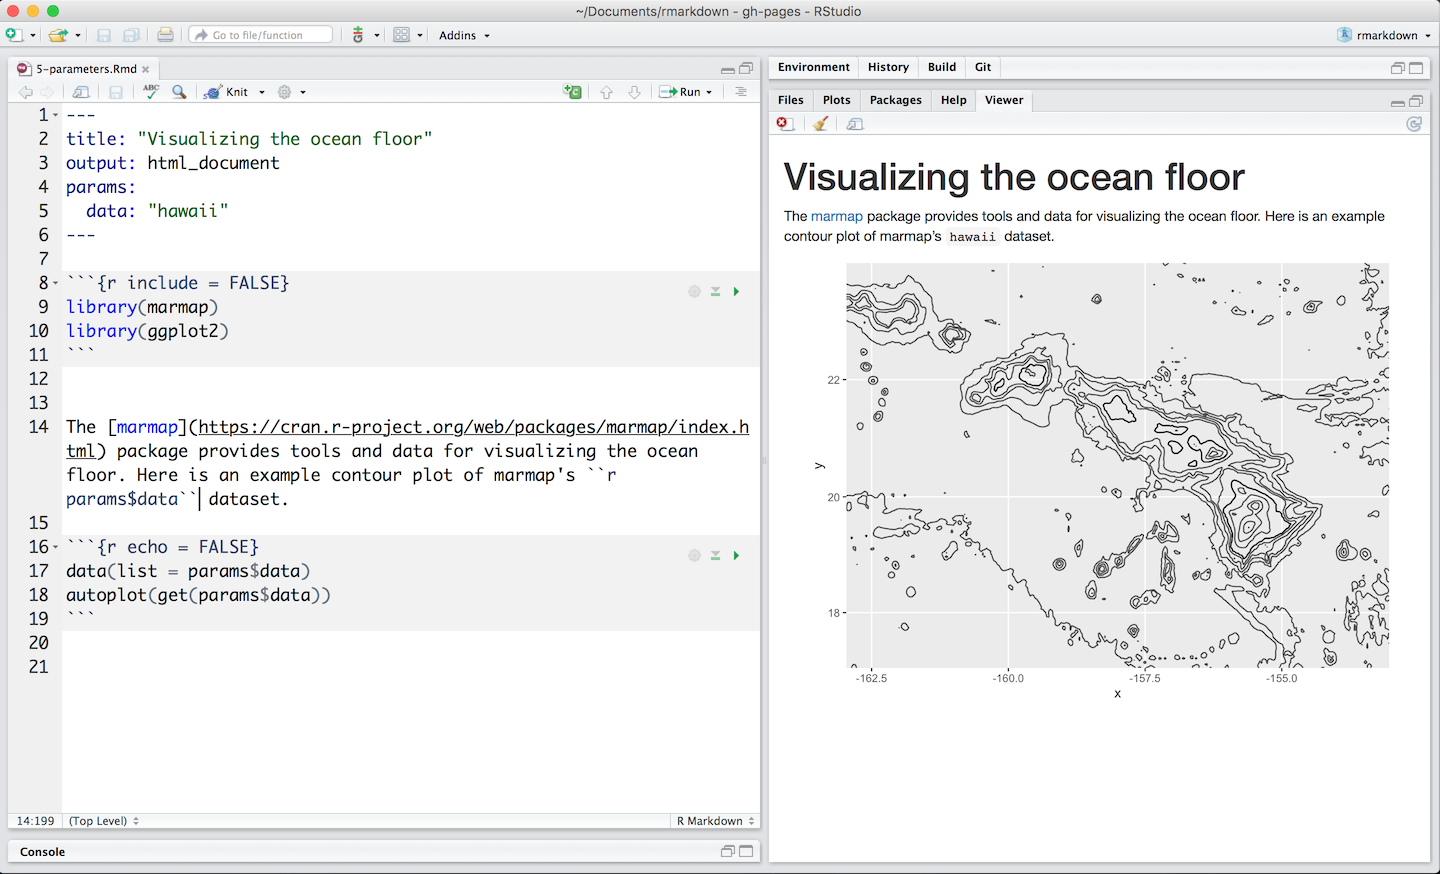
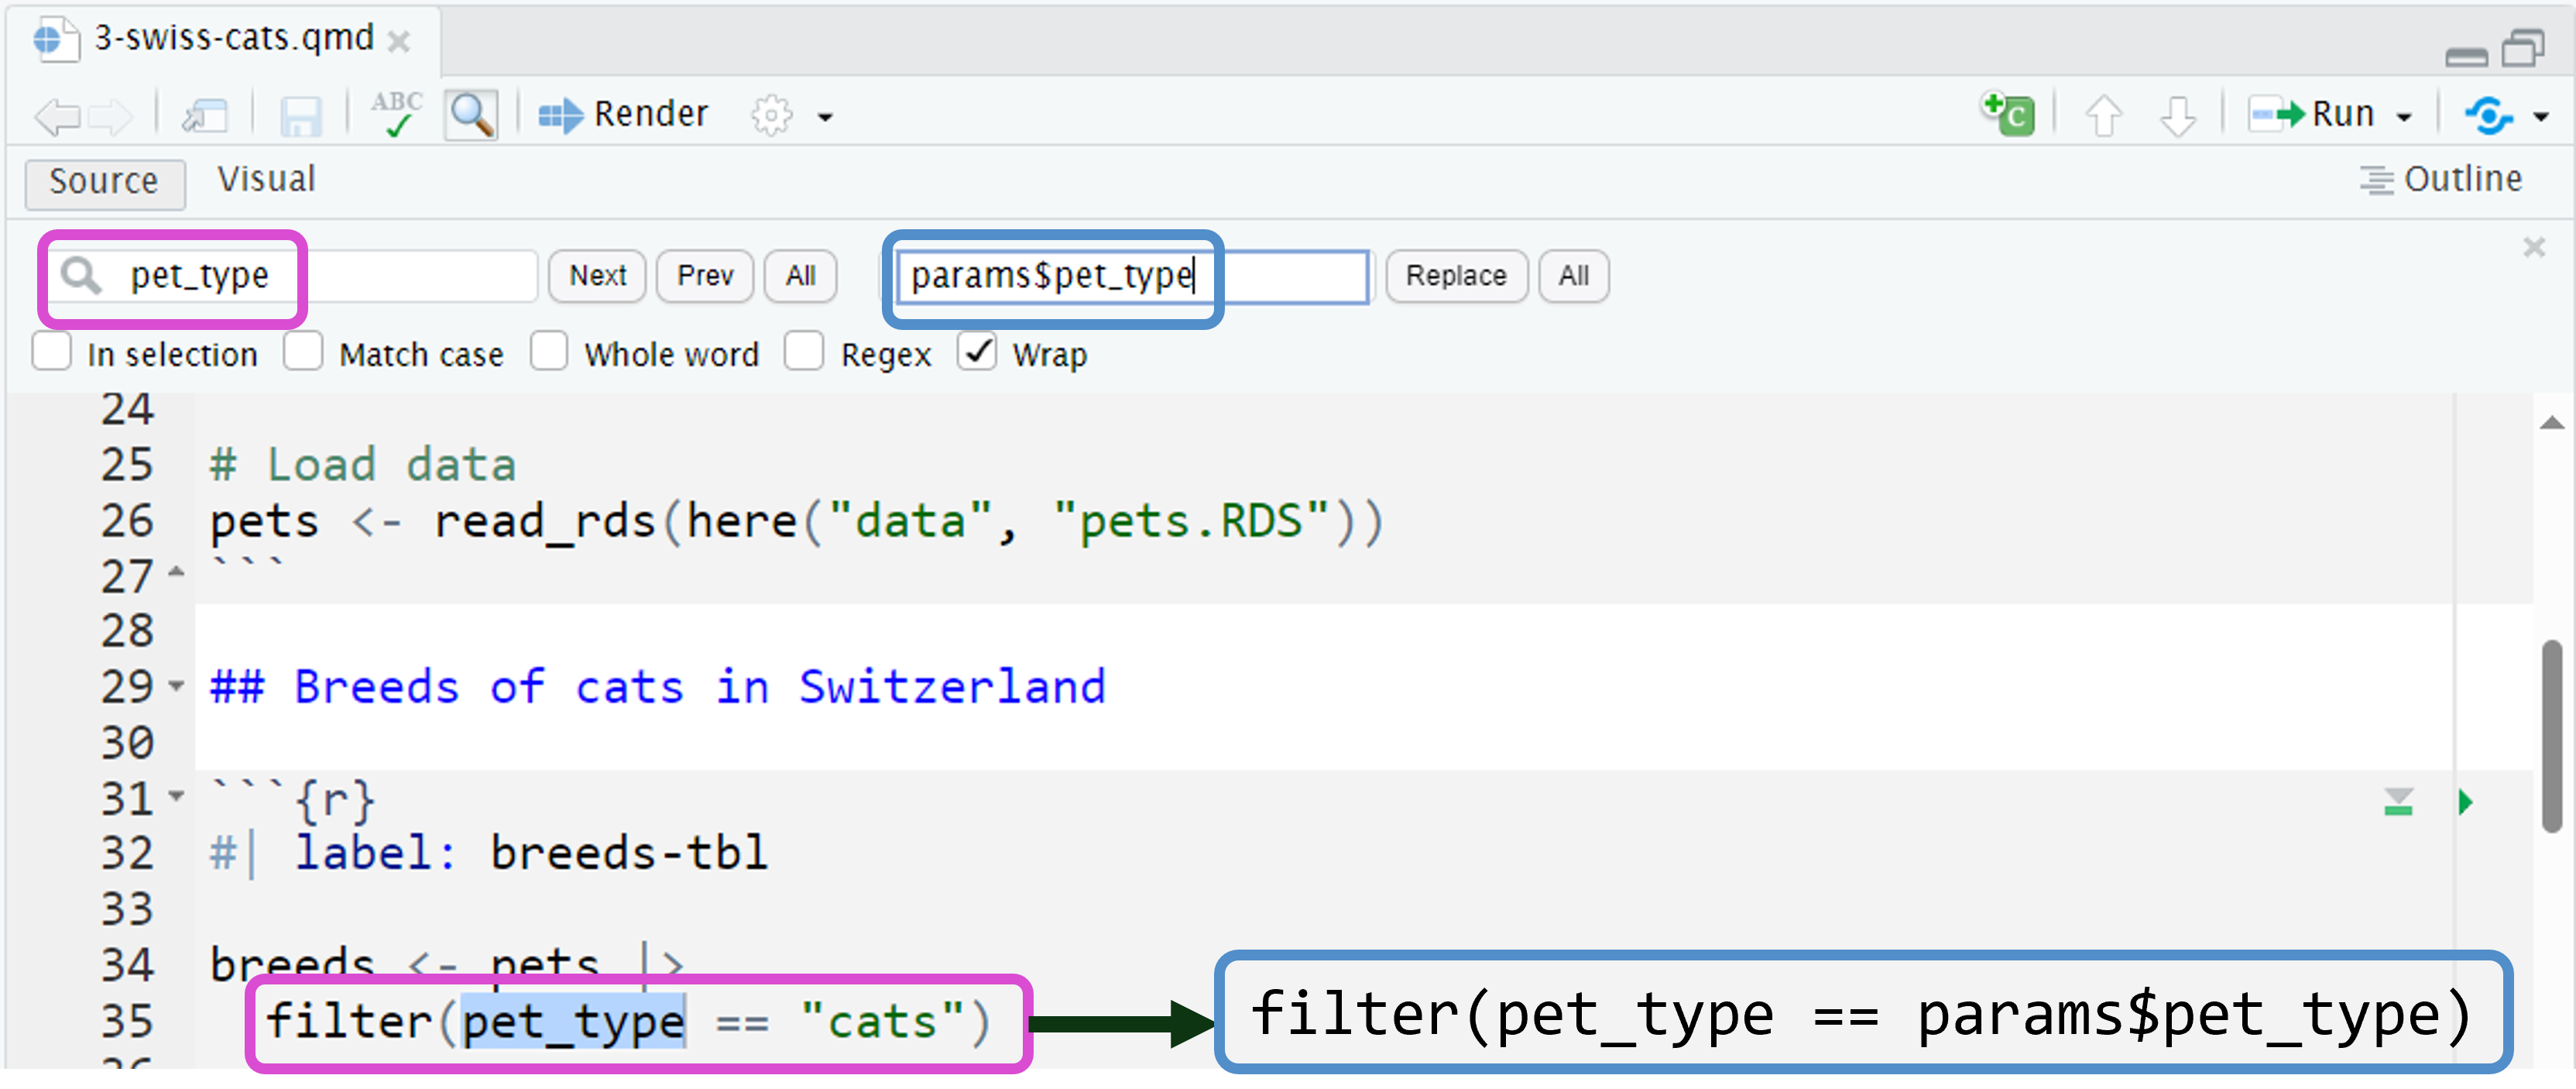
Replace hard-coded values with params
Cmd/Ctrl+Fto find where to replace hard-coded values withparams.
Review three ways to render
RStudio/Quarto integration:
![Quarto render button in RStudio]() Render button in RStudio or
Render button in RStudio or Cmd/Ctrl+Shift+Kkeyboard shortcut✨ Quarto R package ✨
Quarto CLI
💪🏼 Exercise 3-1
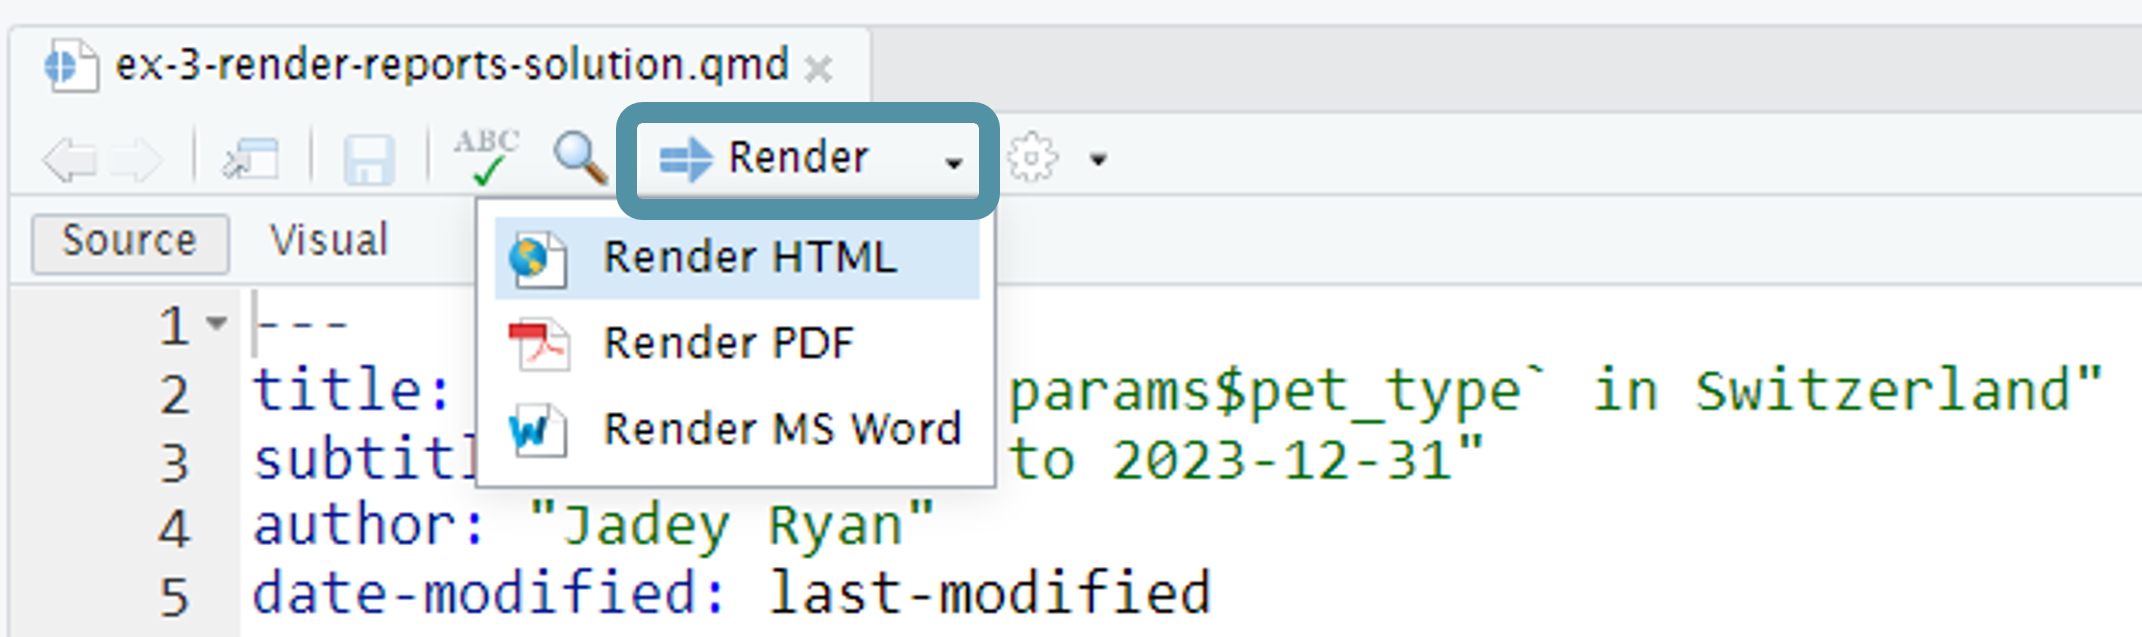
Change parameters in the YAML and render using ![]() Render button.
Render button.
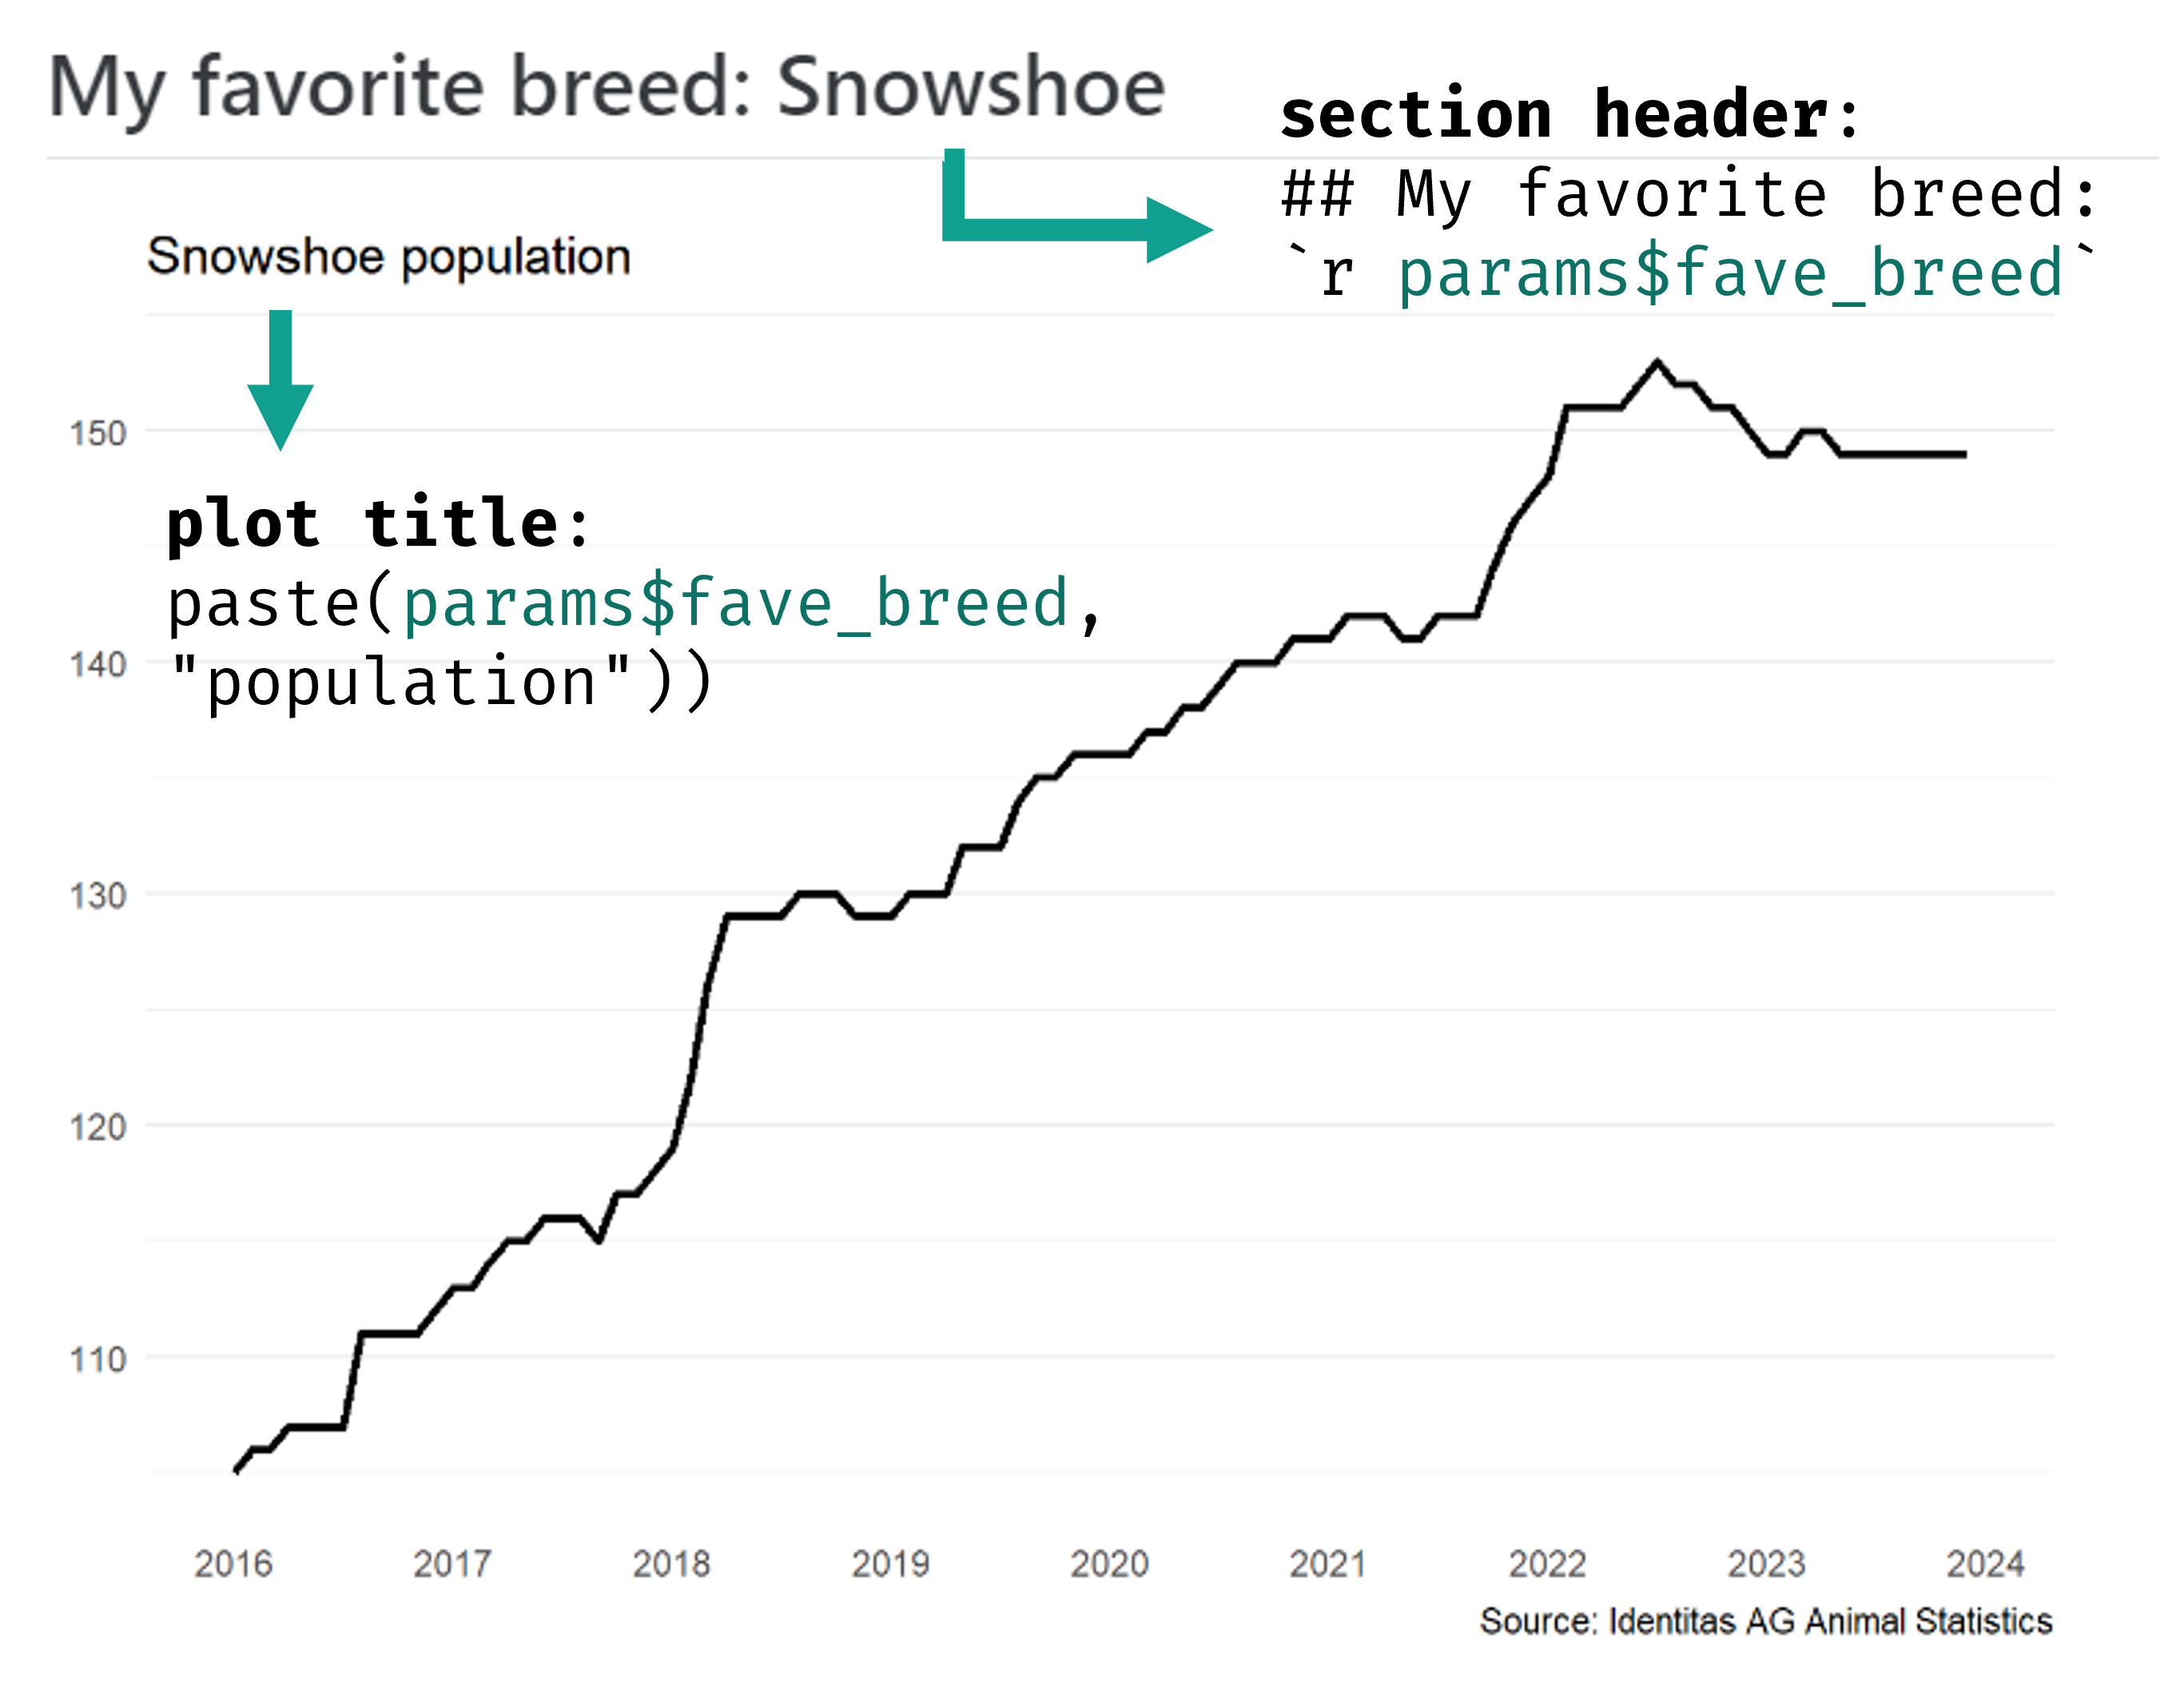
Look at the unique pet breeds and pick your favorite.
In
3-quarto-render.qmdChange the default parameters in the YAML to your favorite pet type and breed. Render using the![Quarto render button in RStudio]() Render button.
Render button.💬 Discuss: Which breed did you pick and why? What do you think will happen if you set the
pet_typedefault parameter to “cats” and thefave_breedparameter to “American Bulldog”?
Try it out!
07:00
purrr map functions for iteration
Map functions apply the same action/function to each element of an object.
Base R
apply()functions are map functions.purrrmap functions have consistent syntax and the output data type is predictable.
for loops → lapply() → purrr::map()
![]()
Learn more:
R-Ladies Baltimore presentation Make your R Code purr with
purrr
Render all reports to all formats
Add to the format: YAML option to render additional output formats from the same .qmd file.
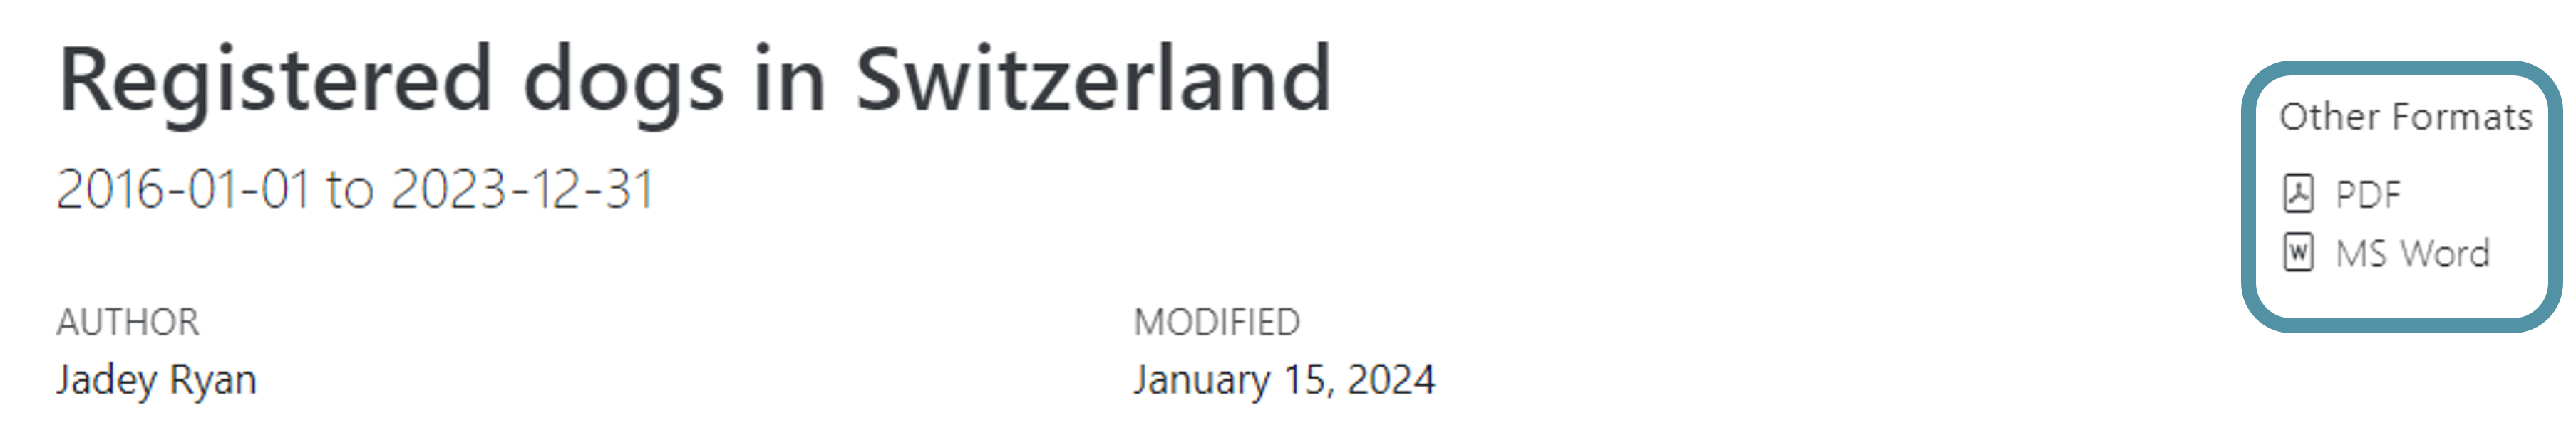
Format links for HTML output
Links to download the other formats will automatically appear in HTML documents.
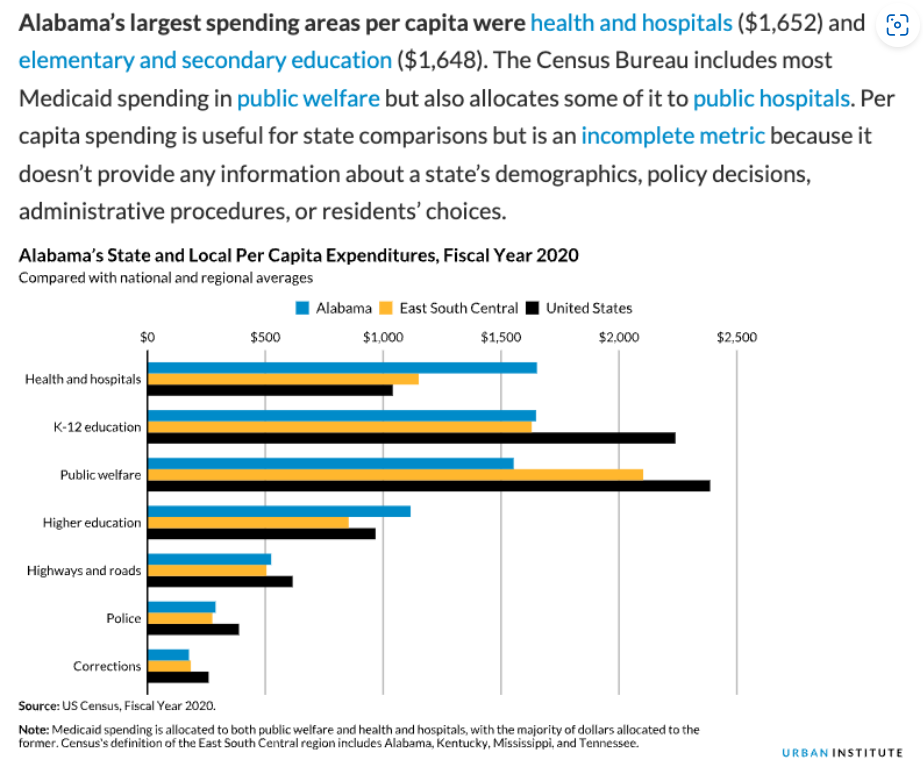
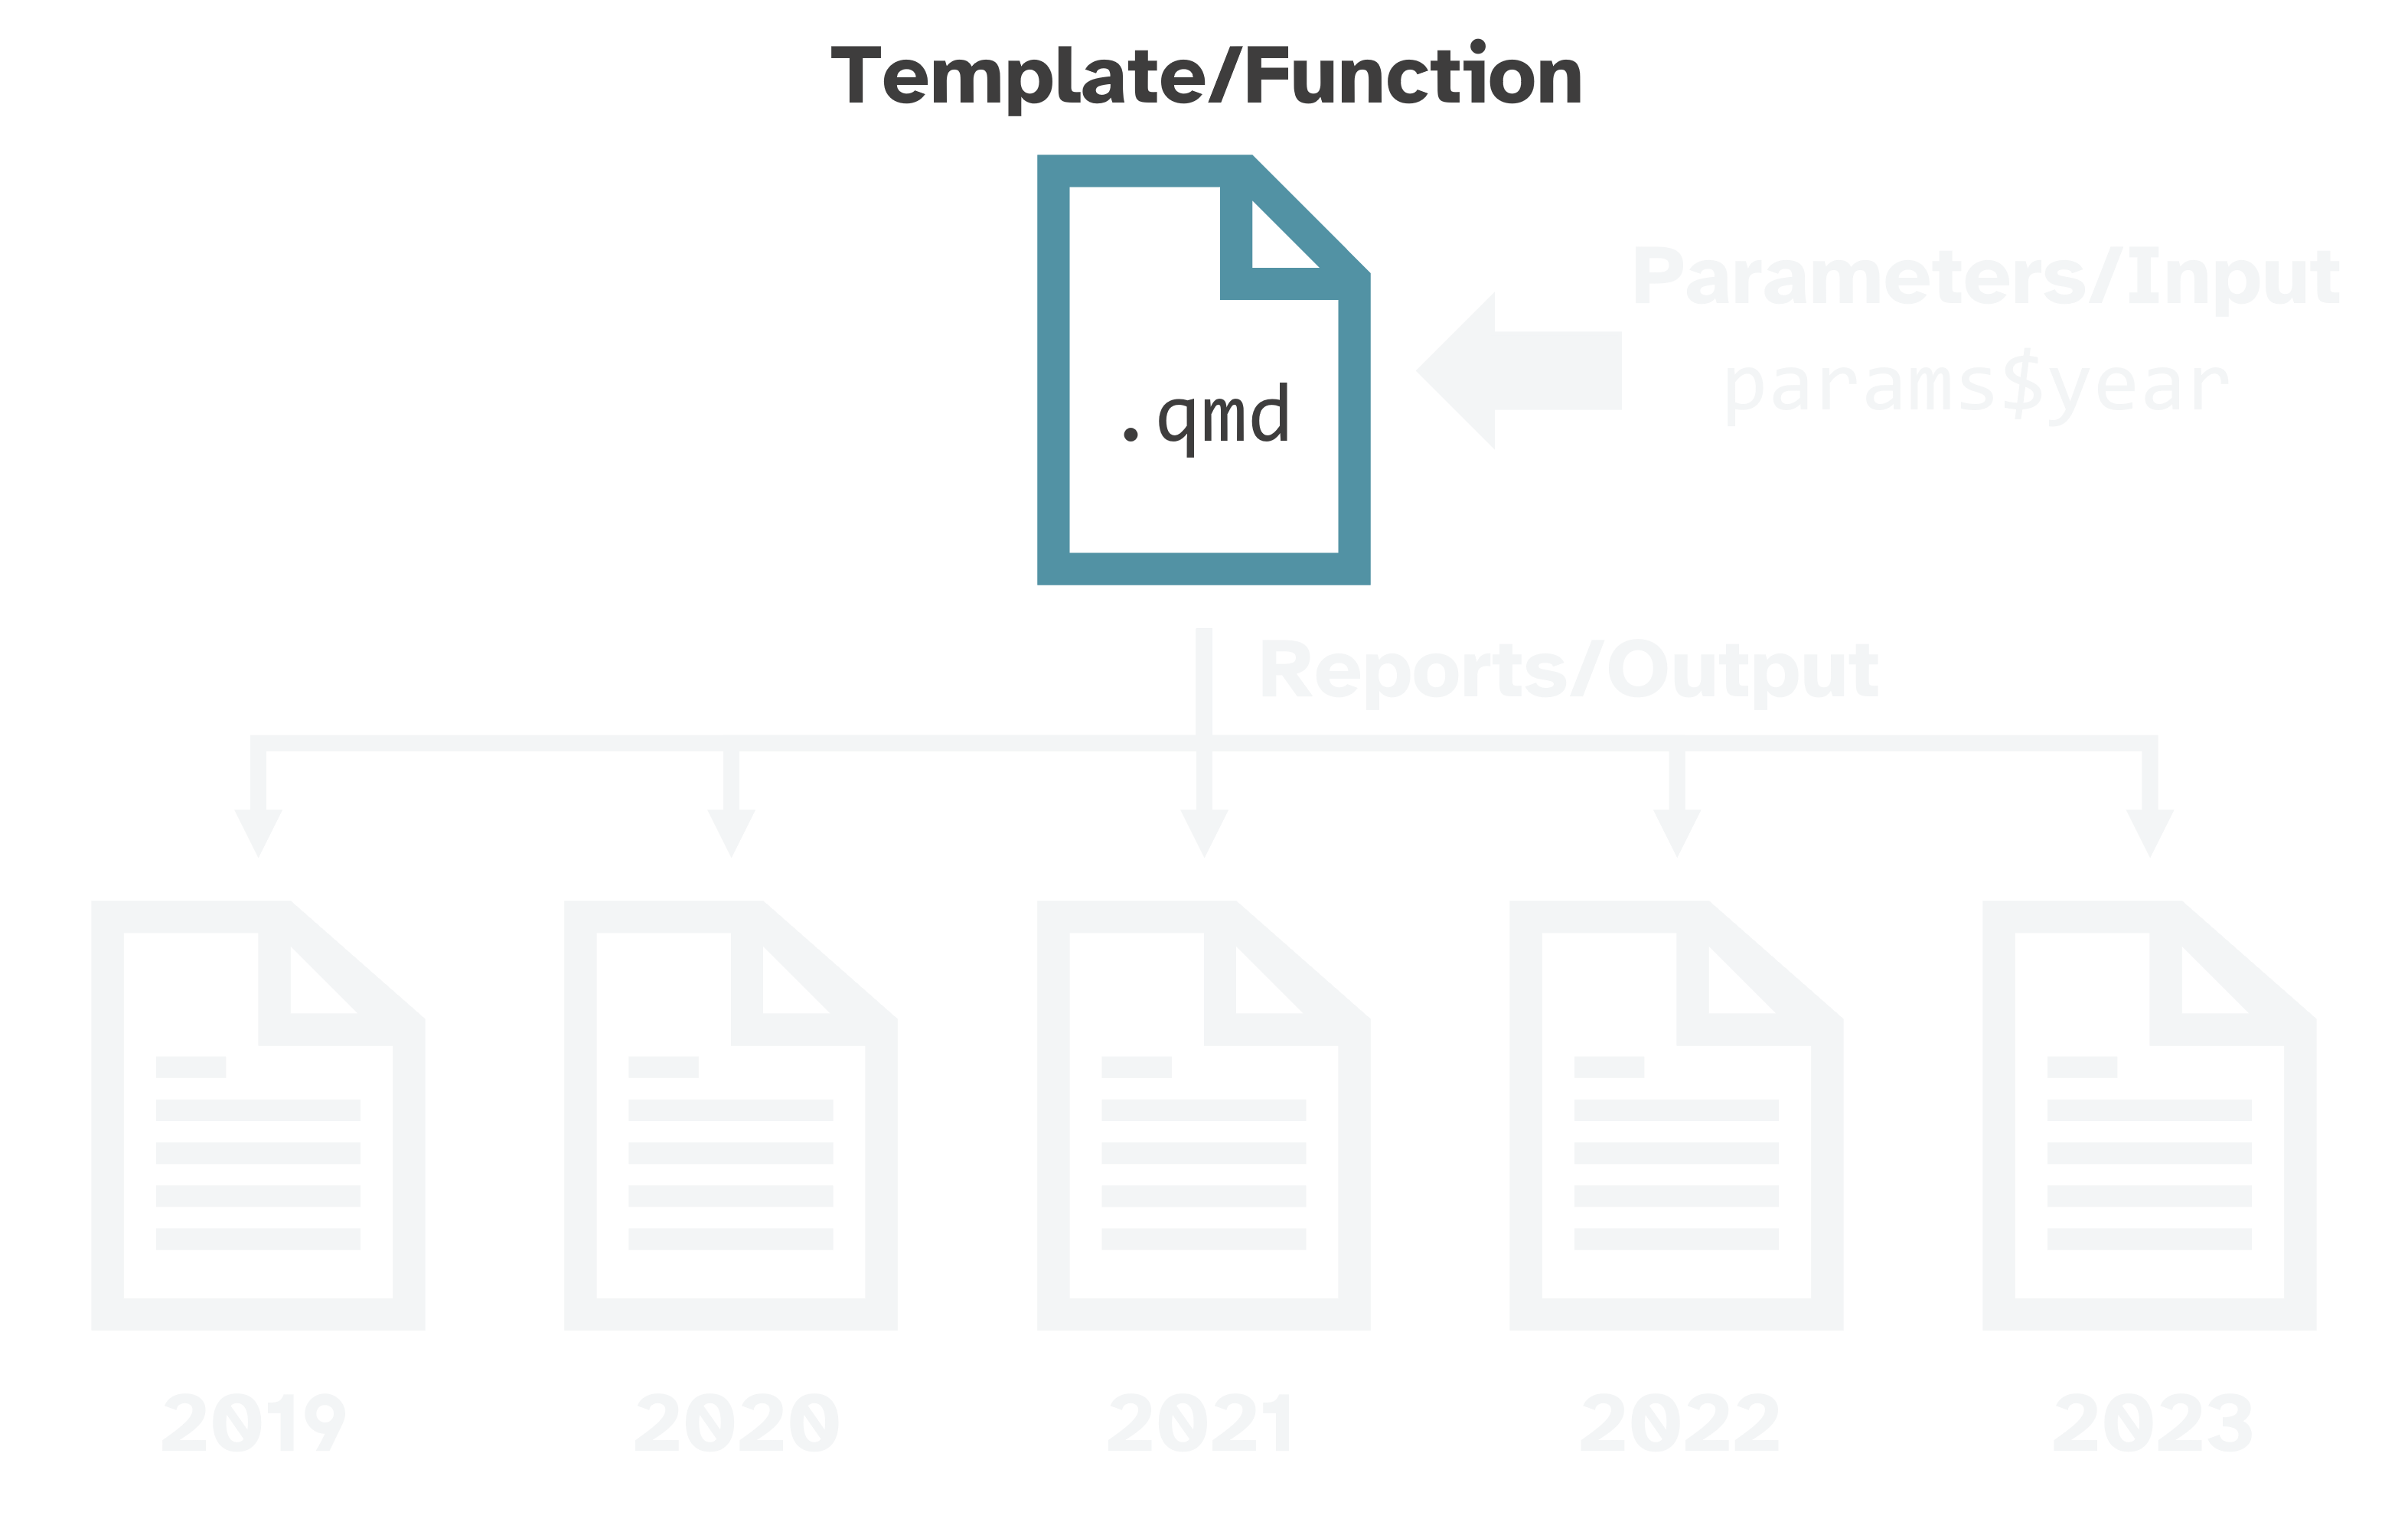
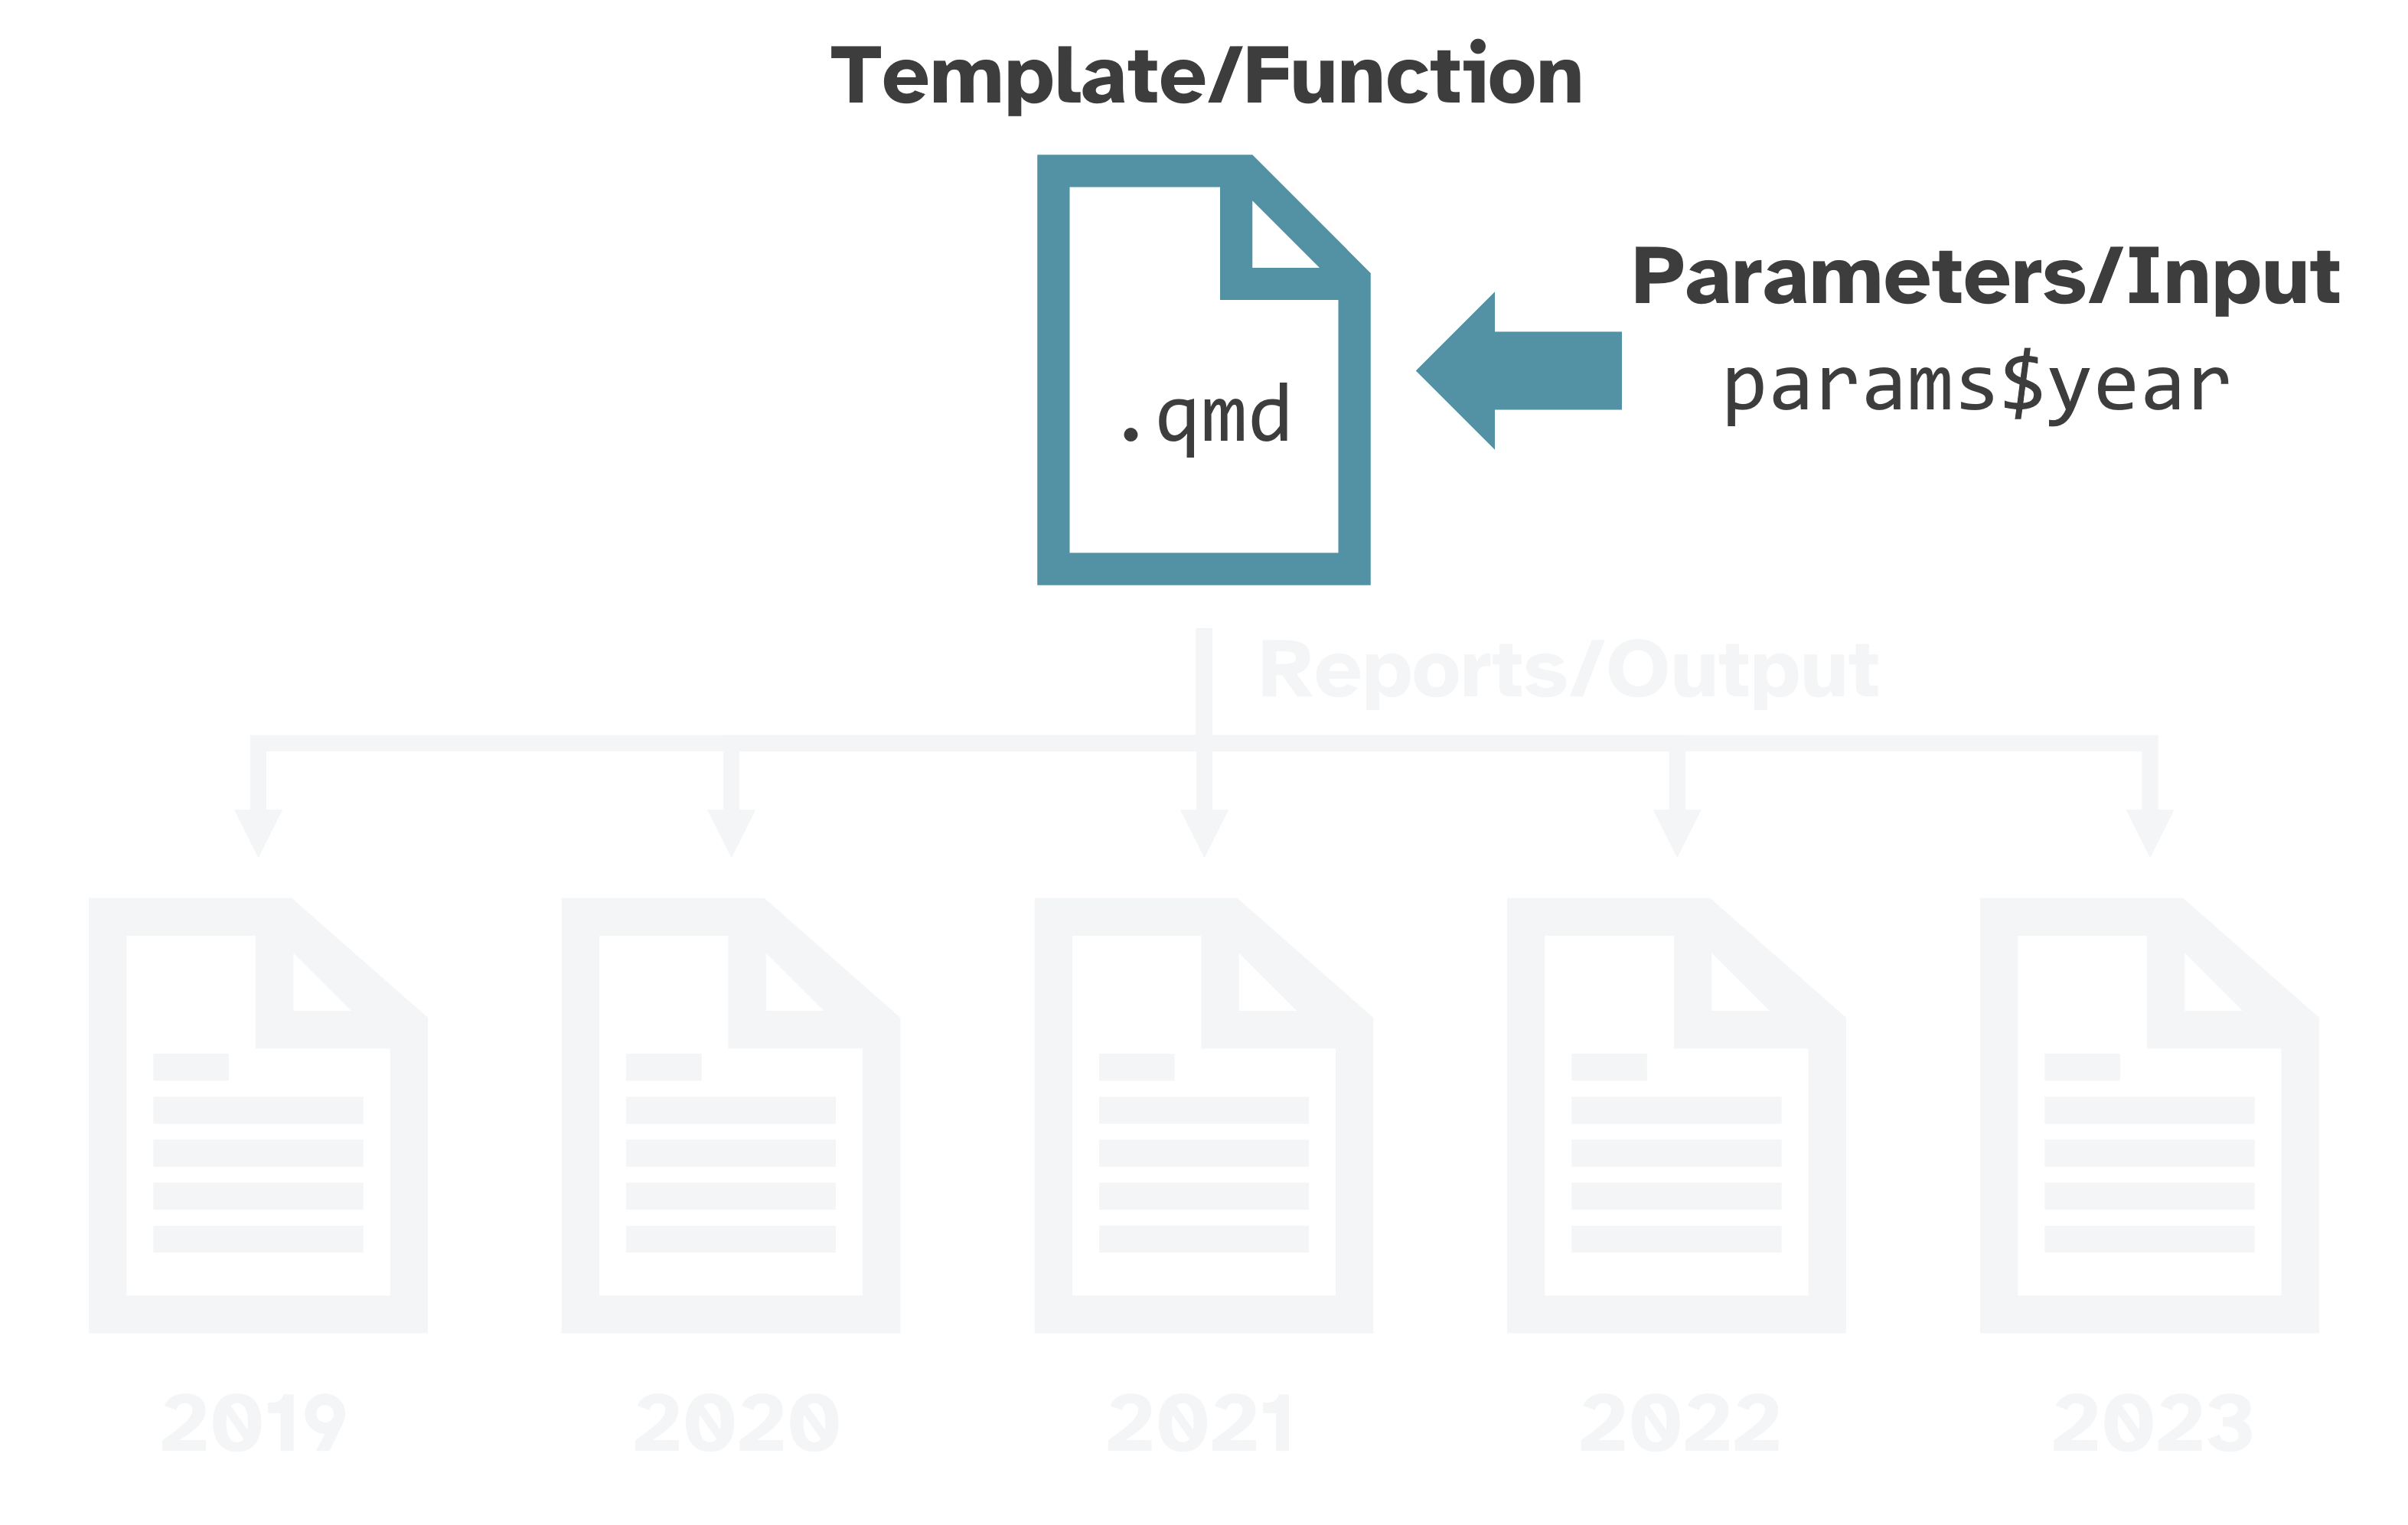
Learning objective 1
Learn what Quarto is and what you can use it for.
Scientific and technical publishing system for:
- interactive HTML reports
- static MS Word or PDF fact sheets or reports
- manuscripts
- presentations
- dashboards
- websites
- books
- blogs
Check out the Quarto Gallery!
Thank you!
🏡 Home for all workshop materials: jadeyryan.quarto.pub/ceds-quarto-workshop/
🎥 Recordings from previous workshops & talks:
links in GitHub repo or my YouTube playlist
![]()